How to Turn Your Parts Operation Into a Profit Engine Before Your Competitors Do
For medical device OEMs, parts readiness is no longer just a logistics concern. It is a direct driver of equipment uptime, technician productivity, customer confidence, and service profitability.
Reading time: 6 minutes
Article Summary: Parts operations are no longer a back-office logistics function. For medical device OEMs and other service-driven organizations, parts readiness directly affects equipment uptime, technician productivity, customer confidence, and service profitability.
The organizations that pull ahead do not simply hold more inventory. They build a more connected parts operation—one that gives leaders better visibility into availability, risk, service demand, and the decisions that affect customer commitments.
Parts operations are no longer a back-office logistics function. For medical device OEMs and other service-driven organizations, parts readiness directly affects equipment uptime, technician productivity, customer confidence, and service profitability.
Why Has Parts Strategy Become a Service Priority?
A parts shortage can create consequences far beyond a delayed shipment. When a technician arrives without the right part, a routine service event can become a repeat visit, an extended equipment outage, an escalation, and a negative customer experience.
That is especially important in medical device service, where uptime, compliance, and clinical workflow are often connected. The right part needs to be available in the right location, at the right time, and with the right technician. If any part of that chain breaks down, the customer feels the impact immediately.
External disruption has made this challenge more visible. Changes in tariffs, import and export requirements, transportation delays, supplier concentration, and weather-related events can all affect the availability and cost of critical components. But the larger issue is not disruption alone. It is whether the service organization has the visibility, sourcing flexibility, and operating discipline to respond before a supply issue becomes a customer issue.
Aquant reports that a failed first visit leads to an average of 2.75 additional visits and 13 extra days to resolve the issue.2 Parts availability is not the only factor behind a failed visit, but it is one of the most controllable. Every avoidable parts-related return trip creates extra labor, travel, equipment downtime, customer disruption, and pressure on the service margin.
What Does a Resilient Parts Operation Look Like?
A resilient parts operation is not defined by the amount of inventory it holds. It is defined by how effectively it supports service outcomes.
The goal is not to add inventory everywhere. It is to improve readiness where it has the greatest effect on uptime, customer experience, and service performance.

How Does Smarter Parts Planning Support Uptime?
Intelligent parts planning means moving beyond static reorder points and reacting only after inventory becomes a problem.
A stronger approach uses available service data to anticipate demand before it creates a stockout. This means looking beyond historical usage alone and understanding patterns in service demand, equipment age, failure behavior, geographic need, criticality, and potential parts risk. The result is a more informed view of what parts will be needed, where they are likely to be needed, and how inventory should be positioned.
Technology should help service leaders identify patterns faster, improve demand forecasting, flag potential shortages, and make better replenishment decisions. The purpose is not to add technology for its own sake. It is to connect data with action before availability becomes a customer issue.
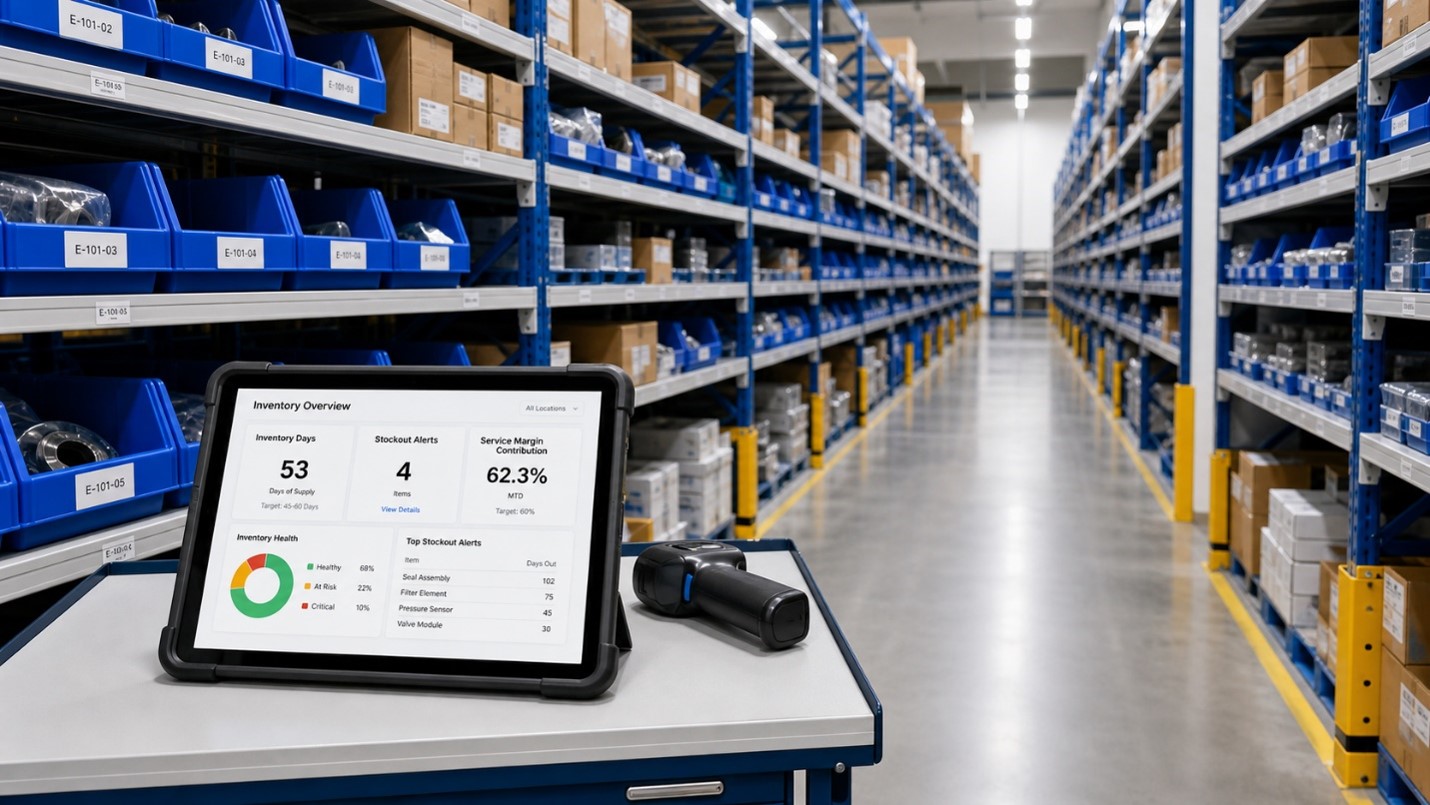
When parts planning is connected to service operations, technicians arrive better prepared. Dispatchers have more confidence in how work is assigned. Customers experience fewer delays. Leaders gain better visibility into where inventory supports service performance and where it is creating risk.
BCG reports that leading industrial manufacturers can maintain 38% fewer days of inventory than the industry average by improving supply-chain performance and inventory positioning.1 Its research also found that top performers’ spare-parts sales are 16 percentage points higher than other companies’ and that spare parts and consumables average gross margins of 50% of sales.1 The lesson is not simply to reduce inventory. It is to manage inventory with greater precision.
How Do You Make the Business Case for Parts Investment?
Parts strategy is often treated as a cost-management conversation. It should be treated as a service-performance and growth conversation.
The first step is to quantify the cost of the current state. Look at how often technicians make return visits because a part was unavailable, incorrectly identified, delayed, or positioned in the wrong location. Consider the cost of freight, overtime, repeat dispatches, SLA risk, customer escalations, lost technician capacity, and additional downtime.
A failed first visit can create a costly chain reaction. Aquant reports that a failed first visit leads to an average of 2.75 additional visits and adds 13 days to issue resolution.2 Even when the exact numbers vary by organization, the operational impact is clear: parts readiness has a direct effect on service experience and cost.
The next step is to connect parts performance to the outcomes executives care about:
A practical investment plan should begin with the highest-impact opportunities. For many organizations, that means identifying the parts, locations, service categories, and customer commitments where parts performance creates the greatest operational and financial risk.
Turn Your Parts Operation Into a Profit Engine With Quest
Quest International helps medical device OEMs build more connected service models around inventory visibility, technician effectiveness, field service, depot repair, warehousing and logistics, and customer commitments.
Our team can help assess where parts availability is creating avoidable service friction, identify high-impact opportunities across the support chain, and develop a focused 12-to-24-month roadmap to improve service readiness, reduce repeat visits, and strengthen the economics of your installed base.
If you are ready to review your current service metrics and identify opportunities to improve parts readiness, contact Quest International to compare where a more connected parts and service model could improve uptime, technician productivity, and customer commitments.
Key Takeaways
Frequently Asked Questions
What is the quickest way to show executives the value of parts strategy?
Start with a simple comparison of current disruption costs and potential service improvements. Show how better critical-part availability, stronger parts attach rates, and fewer avoidable dispatches could affect gross margin, technician capacity, SLA exposure, and customer experience across the installed base over a full year.
How do we know if our current parts network is too concentrated or fragile?
Review your sourcing footprint by region and supplier. A high concentration of critical parts within a limited set of suppliers, countries, transportation routes, or repair locations can increase exposure to disruption, lead-time volatility, and tariff risk.
Where should we start with AI in parts planning?
The right starting point depends on your current service data, parts processes, and the business issues creating the greatest risk. Many organizations begin by improving visibility into demand, inventory, potential shortages, and recurring service patterns before expanding into more advanced forecasting or optimization.
How do parts operations affect technician productivity and customer experience?
Parts readiness directly affects first-time-fix rates, mean time to repair, technician utilization, repeat visits, and avoidable dispatches. When technicians have accurate service history, usable diagnostics, and access to the right part, they can resolve more work in fewer visits and create a more reliable customer experience.
What organizational changes are needed to treat parts as a growth system rather than a cost center?
Leading OEMs connect parts performance to uptime, service margin, renewal risk, and customer-experience outcomes. They improve alignment across supply chain, field service, depot repair, customer care, and finance so inventory decisions support both operational readiness and business growth.
Footer/References
[1] Boston Consulting Group, “Aftermarket Services Drive Growth and Higher Margins for Industrial Manufacturers.” BCG reports that leading industrial manufacturers can stock 38% fewer days of inventory than the industry average by streamlining supply chains. The research also reports that top performers’ spare-parts sales are 16 percentage points higher than other companies’ and that spare parts and consumables average gross margins of 50% of sales.
[2] Aquant, “What First Time Fix Rate Can’t Tell You About Service Performance,” and the Aquant 2025 Field Service Benchmark Report. Aquant reports that a failed first visit leads to an average of 2.75 additional visits and 13 additional days to issue resolution. This source supports the article’s discussion of repeat-visit costs and the importance of readiness before dispatch.
MAR-XXX REV 1.0